How to Measure AI Adoption in Your Engineering Team
2026-11-03 · 10 min read · GitHub & Metrics
Sooner or later, someone above you asks the question: how much of our code is written with AI now?
It sounds simple. It isn't. Most teams answer it with one of two things, and both are wrong in useful ways.
Licence counts tell you who could use an AI tool, not who does. Forty Copilot seats can mean forty heavy users or six heavy users and thirty-four people who installed it once.
Surveys tell you how people feel about their AI use. That's worth knowing — but self-reported usage drifts with enthusiasm, and the same research that shows developers feel much faster with AI often finds the measured speedup is smaller (more on that in vibe coding and your team).
What you want is something observed, from the work itself, that you can track week to week. This guide covers what you can actually detect, how to turn it into a number that's fair to individuals, and — most importantly — how to use it as an Engineering Manager without it becoming a leaderboard.
Three Kinds of AI Use, and Why Only One Leaves a Trace
Before measuring anything, be honest about what can be measured. Engineers use AI in roughly three ways:
- Inline autocomplete — Copilot, Cursor Tab and similar suggest the next few lines as you type. This is the most common form of AI use and it leaves no trace at all. Once accepted, a suggestion is indistinguishable from typed code.
- Chat and copy-paste — asking a model in a browser or IDE panel, then pasting the answer in. Also no trace.
- Agents — tools like Claude Code, Cursor's agent, Devin or the GitHub Copilot coding agent that edit files, run commands and commit on the engineer's behalf. These usually sign their work.
So any measurement from your repos is a floor. It shows agent-assisted work, which is the fastest-growing and highest-leverage kind, and it under-counts everything else — by a different amount for each person. Say this every time you show the number. It changes how the number should be read.
The Signals Agents Leave Behind
There are three reliable signatures.
Co-Authored-By trailers. Git's convention for crediting a second author is a trailer at the end of the commit message. Several agents add one by default:
Add retry queue for webhook deliveries

Co-Authored-By: Claude <noreply@anthropic.com>
GitHub reads these trailers to show co-authors on a commit, which is why tools adopted them.
PR footers. Claude Code, for example, ends the pull request descriptions it writes with a line such as "Generated with Claude Code". A trailer on the commits, a footer on the PR — either is enough.
Bot authors. Fully autonomous agents often open PRs under their own bot account rather than the engineer's. The author login itself tells you it was an agent.
None of this is hidden or invasive. It is metadata the tools put there on purpose, in commits your team has already pushed.
Doing It Yourself
For one repo, git log gets you a rough number in a minute:
# Commits in the last six weeks
git log --since="6 weeks ago" --oneline | wc -l

# ...of which carry an agent's Co-Authored-By trailer
git log --since="6 weeks ago" -i -E \
  --grep="co-authored-by:.*(claude|cursor|copilot|devin|codex|gemini|aider)" \
  --oneline | wc -l
Divide the second by the first and you have a share of commits with an AI trace.
The hard part is everything after that:
- Your team works in more than one repo. Engineers touch services, libraries, infra and docs. Measuring the "main" repo misses most of the picture — often the AI-heavy parts, since agents are popular for exactly the side-repo chores nobody wants to do by hand.
- Commits and PRs both matter. A trailer can be on the commits, the PR, or both. Count only one and you miss work.
- You need it per person and per week. A single team percentage tells leadership something; it tells you almost nothing about who to talk to.
- It goes stale the day you compute it. A number you ran once in September is not a trend.
That's the point where most EMs give up and go back to the survey.
What to Measure: Share of Work, Not Lines
Once you can see the signatures, decide what to count. A few choices matter more than they look.
Count work items, not lines. It's tempting to weight by lines changed. But a trailer applies to a whole commit or PR, not to the specific lines the agent wrote, so lines-weighting mostly measures who makes big PRs. Counting commits and PRs is cruder and fairer.
Combine commits and PRs. Some engineers let the agent commit and then write the PR themselves; others do the reverse. Counting both — "commits and PRs with an AI trace, out of all commits and PRs" — gives one share that works for both styles.
Leave reviews out. An agent signature on a code review means nothing useful. Count the work people author.
Look at it weekly. The interesting question is rarely "what is the number" but "which direction is it going". A team at 15% and rising is in a different place from a team at 30% and flat.
A Fair Adoption Score
A raw share has one flaw: it rewards spikes. An engineer who lets an agent loose on one big migration and never touches it again can look like your heaviest AI user.
If you want a single per-person number, blend how much with how steadily. One formula that works well:
Adoption score = 70% × (share of work with an AI trace) + 30% × (share of active weeks with any AI-assisted work), over the last six weeks.
Six weeks is long enough to smooth out a holiday or an on-call rotation, short enough to reflect a change in habits. Then bucket it so nobody fixates on a single point:
| Score | Level | What it usually means |
|---|---|---|
| 0 | None detected | No agent signatures — not the same as "doesn't use AI" |
| 1–24 | Exploring | Occasional agent use, often for chores |
| 25–59 | Regular | Agents are part of the normal workflow |
| 60+ | AI-first | Most work goes through an agent, most weeks |
The "None detected" label is deliberate. A zero means no signatures found. It might mean someone avoids AI. It might equally mean they use autocomplete all day, or work mostly in design docs and incident reviews.
How to Use It Without Building a Leaderboard
This is where an AI adoption number either helps your team or quietly damages it.
Never rank people by it. The moment an adoption score becomes a target, people add trailers to look good and the number stops meaning anything. It's a lens on how the team works, not a performance metric. Keep it out of performance reviews.
Use it to start conversations. The useful questions are open ones:
- "Your score jumped this month — what changed? What's working?"
- "You're doing a lot with Claude Code on the billing service. Would you show the team your setup?"
- "I don't see agent work from you — is that a choice, or have the tools not fit your work?"
All three are good 1:1 material. None of them is a judgement.
Spread what works. In most teams, a few people have found workflows that genuinely save time. The adoption view tells you who they are. A 20-minute show-and-tell from your AI-first engineer often does more than any rollout plan.
Watch quality alongside adoption. More agent-written code puts more weight on review. If adoption is rising, check that review depth and PR size haven't quietly degraded — see code review in the AI era for what to look for, and keep an eye on whether anyone can still explain the code they merge.
Pair it with delivery metrics when you report upward. "AI-assisted work went from 18% to 32% this quarter" means little on its own. Next to DORA metrics and PR cycle time it starts to say something: adoption is up and cycle time held, or adoption is up and change failure rate crept with it.
What to Tell Leadership
A good AI adoption update fits in three sentences:
- The trend: "Agent-assisted work is 32% of our commits and PRs, up from 21% last quarter."
- The caveat: "This counts only work an agent signed. Autocomplete leaves no trace, so real use is higher."
- The so-what: "Cycle time is flat and review depth held, so we're not trading quality for speed. Next quarter we're spreading the two workflows that work best."
That's more honest than a licence count and more useful than a survey.
How Emtricks Does This
We built AI adoption into Emtricks because we kept wanting this view and nothing gave it to us at the level an EM actually works at.
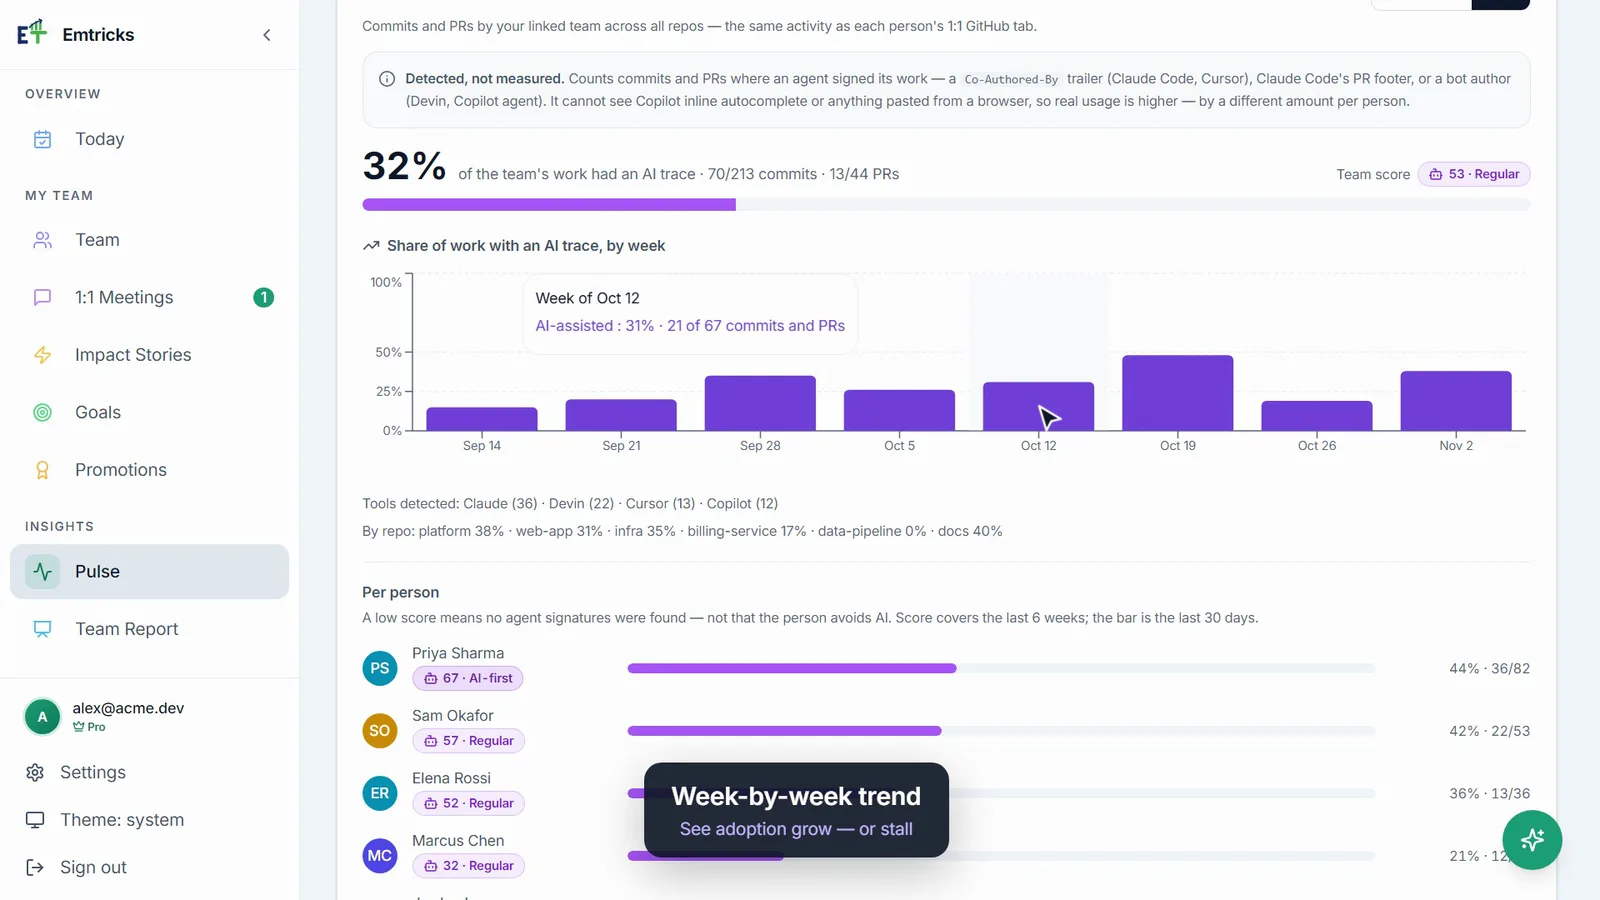
Emtricks reads your linked engineers' commits and PRs across every repo they work in and detects the three signatures above. The Pulse AI adoption tab shows the team's share of AI-assisted work, a week-by-week trend, the tools and repos involved, and a team score:
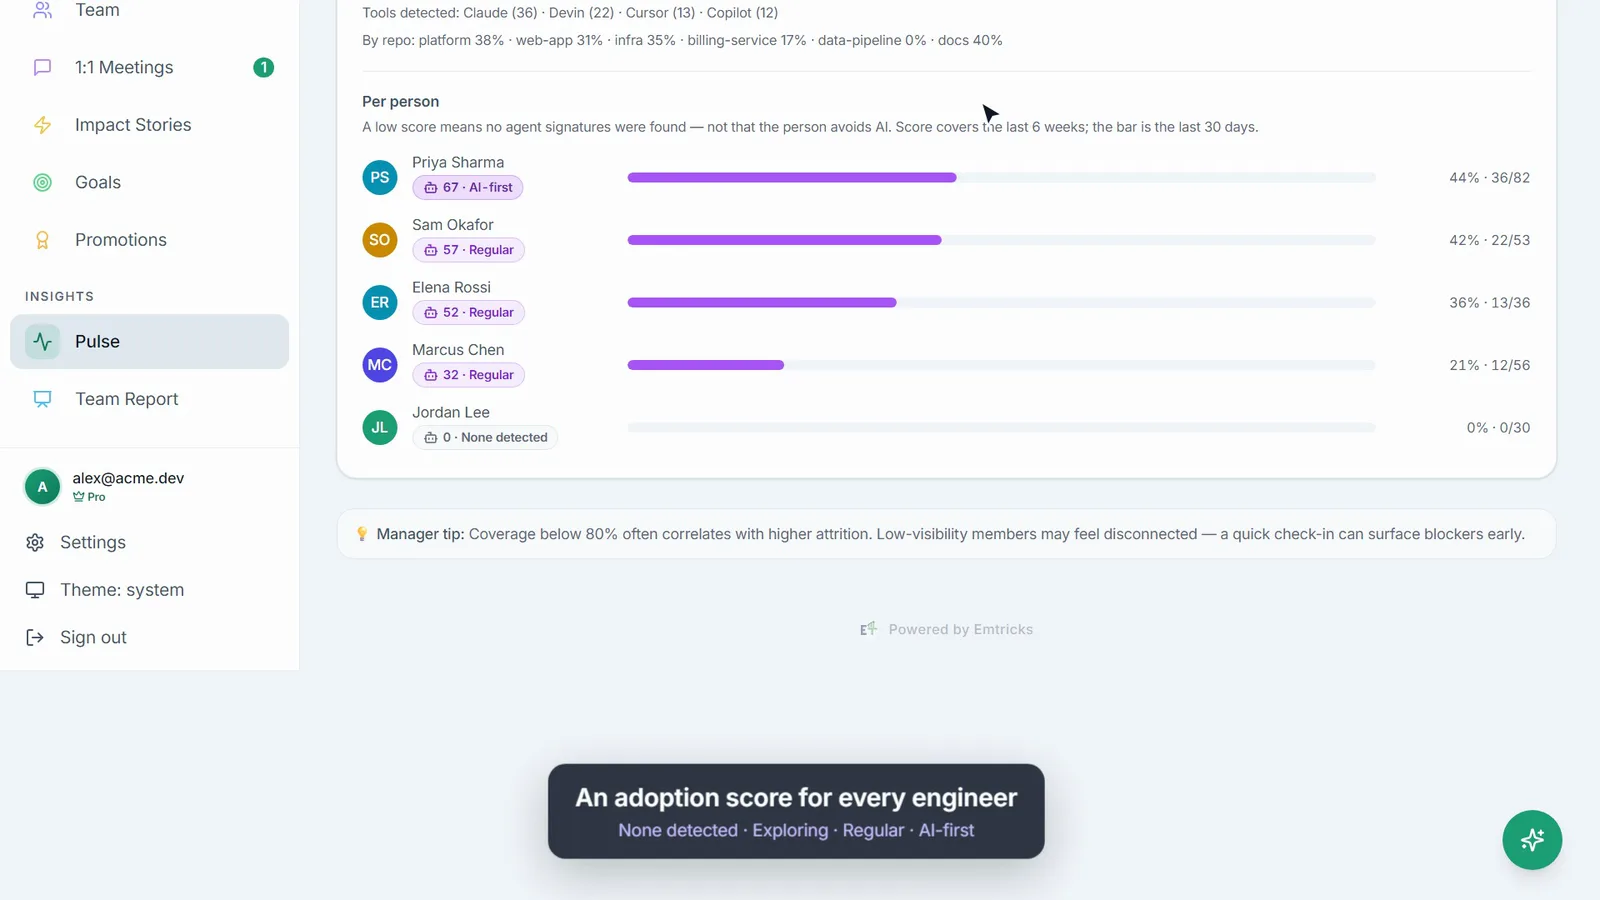
Every engineer gets the six-week adoption score described above, from None detected to AI-first:
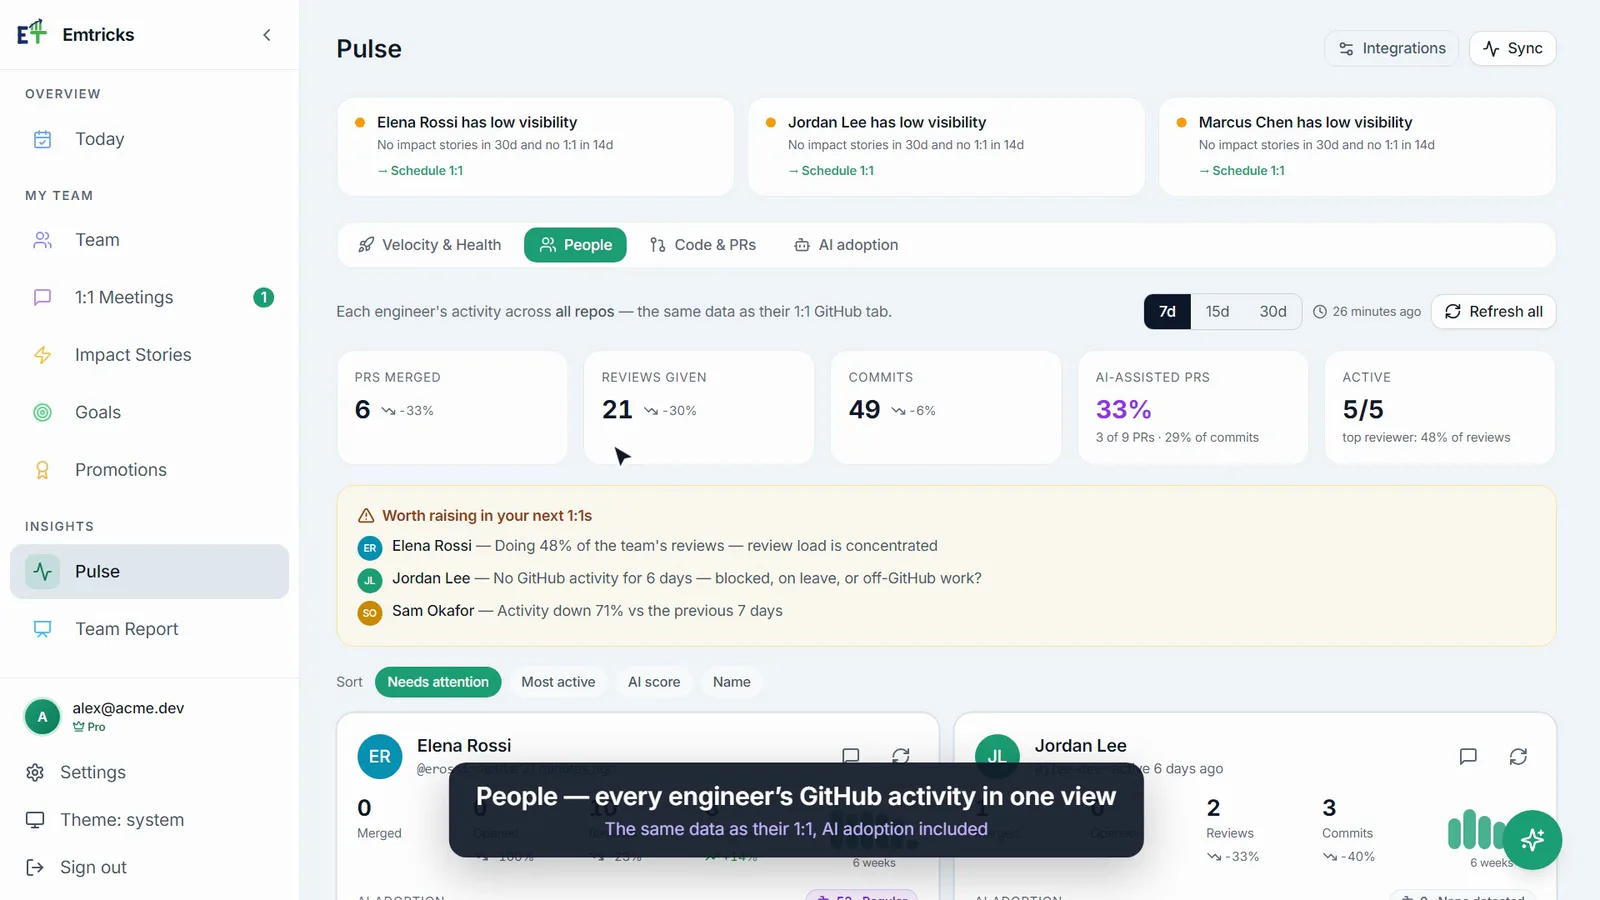
The People tab puts it next to everything else you know about each engineer's GitHub activity — and you can sort by it to see who to learn from:
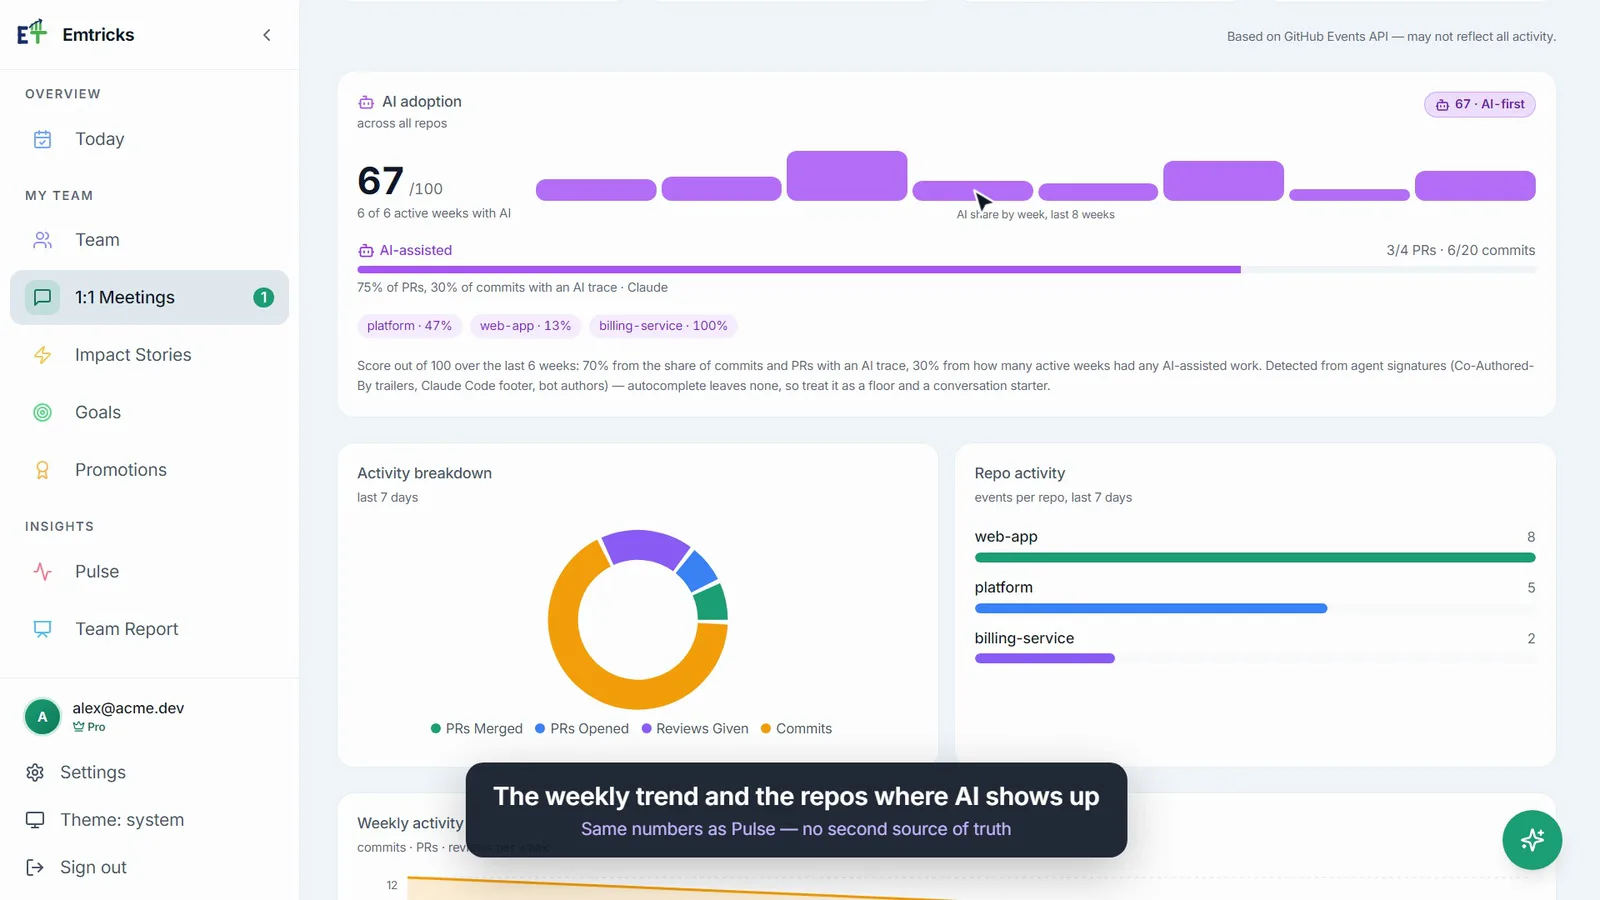
And the same numbers appear on each engineer's 1:1 page, so it becomes a conversation in the meeting where it belongs:
(Screenshots use a fictional sample team.)
Every view uses the same data, so the number in Pulse, the number in the 1:1 and the number in the Team Report you send upward always agree.
Go Deeper
- How to tell if your engineers use Claude Code, Cursor or Copilot (without surveillance)
- Co-Authored-By trailers explained: what AI coding agents leave in your Git history
- AI adoption metrics for engineering leaders: what to track and what to ignore
- How to talk about AI usage in 1:1s
- Rolling out coding agents to your team: a 90-day plan
Key Takeaways
- Licence counts and surveys don't measure AI adoption. The work itself does.
- Only agent-assisted work leaves a trace — Co-Authored-By trailers, PR footers, bot authors — so every number is a floor.
- Measure across every repo, count commits and PRs together, and watch the weekly trend.
- If you score individuals, blend share with consistency, and treat zero as "none detected", not "doesn't use AI".
- Use it to start conversations and spread good workflows — never as a ranking.
See your team's AI adoption alongside 1:1s, impact stories and goals — all in one place. Try Emtricks free for 30 days.